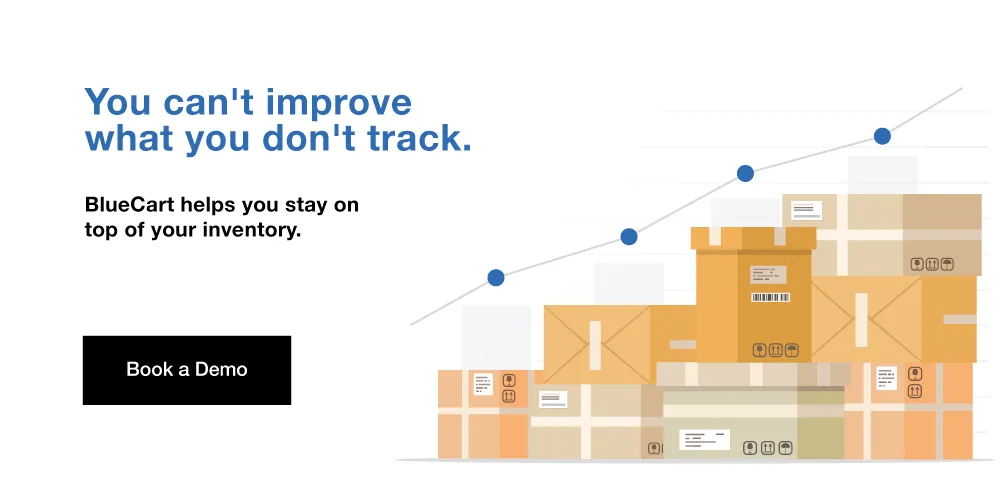
How good is your inventory management process?
Tough to say, sometimes. And that’s a big problem. Because your inventory is one of your most valuable assets (see: what is inventory). If you’re not treating it with care, what are you treating with care?
A lot of people will ask that question about your business if your inventory KPIs are lackluster.
KPI stands for “key performance indicator.”
An inventory management KPI is a number or metric companies track to gauge the efficiency of their inventory management. They give you visibility into performance and a measuring stick to track success.
Here we’ll look at six crucial inventory management KPIs and exactly what they mean. In each section you can click to a post with much more detailed information about each inventory KPI.
Sales Inventory KPIs
Inventory Turnover Ratio
Inventory turnover ratio measures how many times a company has sold and replaced its inventory over a specific time frame. You’ll need to calculate your cost of goods sold and average inventory formula to calculate your inventory turnover.
Take, for example, a company with a turnover for a specific SKU number at 3. That means that product is sold and replaced 3 times over the period analyzed. Accepted industry standards are that inventory turnover rates below 5 aren’t ideal. Most high-performing businesses tend to have inventory turnover from 5 to 10.
High inventory turnover means a company is purchasing and selling inventory optimally. It speaks to their ability to turn raw materials inventory into finished goods inventory and offload them. Which is, ultimately, the point of any manufacturing and supply business.
Alternatively, low inventory turnover signals poor purchasing, sales, and marketing strategies. If you’re not getting rid of inventory, it’s taking up space and tying up cash.
But “good” means different things in different industries. That’s why it’s always important to benchmark your turnover rate. Hold yourself to your own historical numbers and you’ll be able to make progress.
Inventory Days
Another useful sales-focused inventory KPI is days sales in inventory (DSI).
It’s also known as:
- Days Inventory Outstanding (DIO)
- Inventory Days On Hand (DOH)
- Inventory Turnover Days
- Inventory Days
It’s a ratio that shows how many days, on average, it takes a company to sell its inventory. The lower this number is, the better. That means inventory is on hand for less time. That results in lower carrying costs and less cash tied up in inventory.
It sounds similar to turnover ratio, right?
Well, here’s the difference:
Inventory turnover ratio is a measure of how fast a company turns raw materials into sold finished goods. Inventory days measures the actual number of days it takes that inventory to sell.
So, why does DSI matter?
Simple:
The lower the number, the less cash is tied up in sitting inventory. And the lower the risk of that inventory becoming obsolete and worthless.
It’s also an important measuring stick for stockholders, board members, and leadership. It shows that management is succeeding at their primary duty: turning inventory into sales. A company like that inspires confidence.
Sell Through Rate
Next up is sell through rate. It’s a percentage that indicates how much of your received inventory was sold over a specific period of time.
Businesses use sell through to estimate how much finished goods inventory or merchandise inventory will be sold—based on raw inventory numbers. That shows how confidently one can expect an investment in inventory to become revenue.
Here’s how that’s different from the above inventory KPIs:
It doesn’t measure the time (inventory days) or speed (turnover ratio) of inventory movement. It measures the total percentage of what you sell or what you receive.
Like turnover, it’s a good way to measure the efficiency of your supply chain, demand forecasting, and purchasing and pricing strategies.
When it’s high, that means you’re purchasing the appropriate amount of inventory for demand. And it means that inventory is moving through your manufacturing process smoothly.
A low sell through, on the other hand, indicates:
- You’re ordering too much inventory
- There’s not enough demand
- Your price is too high
It varies by company and industry, but accepted wisdom is that a sell through rate above 80% is good. Average sell through is about 40% to 80%.
Keep in mind, though, that sell through rate increases over time. The longer a product is on a shelf, actively being sold, the more likely it is to eventually sell.
Operational Inventory KPIs
These next three inventory KPIs focus more on the operational efficiency of your inventory management. They are average inventory, shrinkage, and carrying cost.
Average Inventory
Price changes are constant when purchasing from wholesalers, even using an online marketplace. And that makes inventory costing tricky. That’s where average inventory helps.
Average inventory is the mean value of a business’s inventory over a set time period. The calculation is simple: add beginning inventory to ending inventory and divide by two.
Here’s why knowing the average value of inventory is a useful inventory KPI:
- It provides a window into how much money is typically tied up in inventory at any given moment in time
- It indicates your average inventory level, or the number of units you have at any given time.
Both of those are useful measures of how lean your inventory management process is. And using averages smoothes the numbers, removing noisy outliers.
If average inventory is too high, there may be other symptoms, too. Like low turnover rate, high DSI, or low sell through rate. That causes high inventory carrying cost and the risk of inventory obsolescence. It’s another number to look at to confirm a suspected diagnosis of stagnant, inefficient inventory management.
Or confirm a clean bill of inventory health.
Average inventory isn’t typically reported on a balance sheet. It’s usually used to calculate inventory turnover ratio and provide context around other inventory KPIs.
Inventory Shrinkage
Shrinkage is recorded when you have less inventory than your records indicate you should. That’s because something is causing items to disappear before they’re sold. It’s also commonly referred to as variance in the hospitality industry.
It’s a problem that haunts every stage of the supply chain and every type of business.
And it’s unavoidable. The median shrinkage for 2018 was 1%. Therefore, common wisdom states that an acceptable level of shrinkage is less than 1%.
In 2019, inventory shrinkage accounted for 1.38% of all retail “sales.” That’s about 48 billion dollars.
Every single business has some level of shrinkage. It’s not possible to eradicate it. But it is possible to monitor and lower it. That’s a big part of successful inventory management and that’s why it’s an inventory KPI worth talking about.
Because most businesses know shrinkage can’t be eliminated, they adjust their prices to make up for it. That may mean lowering prices to sell more product or raising prices for higher margins. The method chosen depends on the mathematical reality of how gross profit margin is best optimized for that business.
Common Shrinkage Causes
Let’s look at the six main causes of variance.
- Theft. This can be external theft (shoplifting) or internal employee theft. In 2017, external theft or shoplifting was responsible for 37.5% of retail shrinkage. And 33.2% of retail shrinkage was caused by internal theft.
- Spoilage and waste. Perishable products not used by expiration or non-perishable products that become obsolete.
- Damage. Any product that’s damaged past the point of resale is considered shrinkage.
- Human error. In hospitality, this can be overpouring a glass of wine. In retail, ringing up the wrong item. And in manufacturing, using too much raw material or overloading a pallet.
- Administrative errors. Any mistakes made during the accounting process, if identified, can be recorded as shrinkage. This even includes clerical errors like premature ordering, which might result in sitting inventory that ends up expiring.
- Supplier fraud. Wholesale orders can be so large that it’s effectively impossible to quality-control all of them. Some unscrupulous vendors take advantage of that and skim off the top. Imagine receiving 10,000 units. There may only be 9,700, and the only way for you to know is to count ‘em up.
Last but not least of the operationally-focused inventory KPIs is carrying cost.

Inventory Carrying Cost
Inventory carrying cost is all the expenses related to holding and storing inventory waiting to be sold. Carrying costs are represented as a percentage of total inventory value over a set time period.
Carrying cost is composed of:
- Capital costs. The money invested in the inventory and inventory management.
- Warehousing costs like rent, security, utilities, labor, etc.
- Inventory costs like shrinkage and insurance
- The opportunity cost of holding inventory, devoting labor to handling, and generally being unable to invest the money tied up in inventory elsewhere
So why do businesses hold onto inventory and incur carrying costs? Because they have to. It’s the cost of doing business.
Here’s why:
- They need buffer stock and safety stock. This is product kept on hand for unforeseen and foreseen demand fluctuations in supply and demand.
- They have pipeline inventory. Inventory that’s moving from one part of the supply chain to the next.
- They have dead stock (see dead stock meaning). Any stock that’s lapsed and has become sitting inventory.
- They keep cycle inventory. Inventory kept on hand to fulfill regular sales orders.
What’s a Good Carrying Cost?
A 2018 APICS study cited an accepted ideal carrying cost of 15–25%. But, again, it depends on industry and company, and can shoot up to 75%.
Want to reduce carrying costs?
Here’s how:
- Pay extra attention to demand forecasting
- Make your warehouse layout easier to navigate (this helps find and ship products faster, decreasing DSI, and decreasing carrying costs)
- Look into long-term vendor contracts
- Use all the historical data you can
Inventory Costing Methods
Inventory costing methods are related to inventory KPIs. Though they measure the value of your inventory. Not the performance of your inventory management or health of your supply chain.
Nevertheless, there are many valuable conclusions to draw from accurate inventory costing. And every successful inventory management operation monitors both value and performance.
Here’s how they do it.
FIFO Method
The first-in first-out method, or FIFO, assumes that the goods you acquire first are the goods you sell first.
It’s useful for companies with inventory that’s perishable or has short demand cycles.
LIFO Method
The last-in first-out method, or LIFO, assumes that a business’s most recently acquired inventory is sold first. That makes COGS and the cost of goods available for sale a reflection of the most recent product valuations.
This is a popular method for industries with frequent price increases. That way the more expensive goods are used and recorded first.
HIFO Method
Highest in, first out, or HIFO, assumes that the inventory with the highest purchase price is used and sold first. That makes the COGS as high as possible. It’s not a commonly used costing method. It decreases taxable income for a short period of time, and it’s generally not considered a best practice.
Weighted Average Method
This method assigns value to items by taking the total COGS and dividing it by the total number of inventory items.
Then businesses can multiply the ending inventory count by the average cost and get an accurate estimation of the cost of goods available for sale.
Moving Average Method
The moving average method recalculates the average inventory cost with each inventory purchase. That puts it between FIFO and LIFO, in a risk-averse goldilocks zone.
That also means it changed with every purchase. Companies that depend on perpetual inventory typically use this costing method. Because it requires real-time updating and that’s the primary feature of perpetual inventory.
Inventory Replacement Cost Method
You can also cost inventory by assigning value based on the cost to replace that inventory item after it’s sold.
The value then changed over time based on vendor pricing at the time of replacement. Along with any other discounts, like bulk shipping discounts, you may get on your order. on supplier pricing at the time of replacement.
Lower of Cost or Market Rule
Lower of cost or market assigns value to inventory at the inventory’s purchase price or the inventory’s current market value. Whichever is lower.
Inventory value changed over time. And sometimes the market value of inventory is less than the cost paid for it. It allows businesses to experience value loss while mitigating the size of the loss.
It’s typically used for businesses that hold onto inventory for a long time, where market conditions can evolve substantially.
Inventory KPIs: Learn to Love ‘Em
Your inventory management KPIs are the best way to isolate and improve your business’s inventory management.
They’re also important for any outside party judging your business. Your business may be profitable, sure, but is it sustainable? Do you have a winning formula that won’t crash and burn?
Solid inventory KPIs answer that question.
If you want to attract top talent, investors, and partnerships, these are the sorts of things your business needs to track and master.